What is the Sludge Volume Index (SV)?
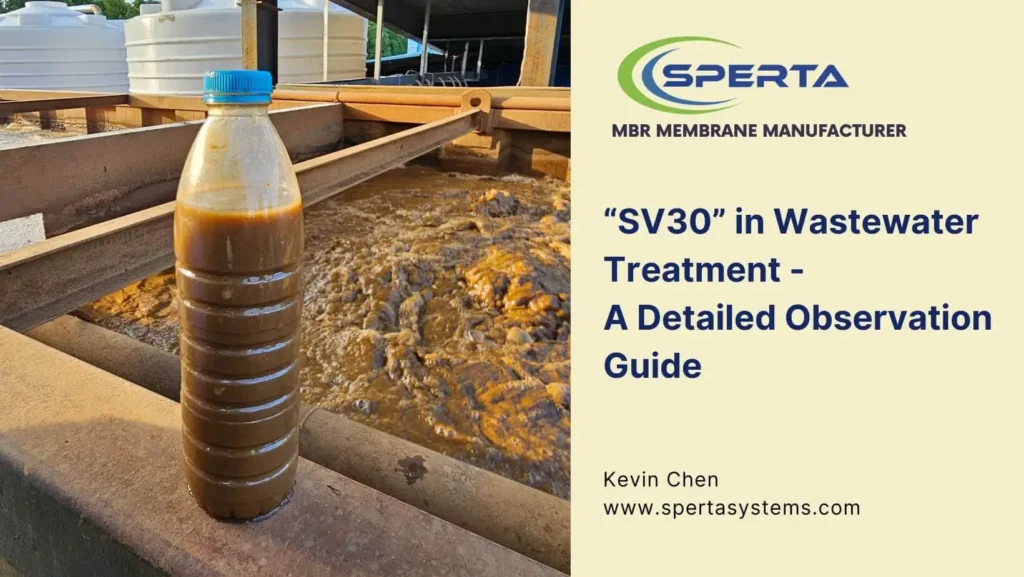
The Sludge Volume Index (SV) is a crucial indicator in the wastewater treatment process. It refers to the percentage volume occupied by sludge in a measuring cylinder after allowing the mixed liquor from the aeration tank to settle for 30 minutes.
The Sludge Volume Index (SV) test is not just about obtaining a numerical result; it involves understanding the entire sludge settling process. Through detailed observation and analysis, comprehensive and accurate conclusions can be drawn to guide production control. Therefore, how to conduct regular Sludge Volume Index (SV) tests is a very important issue.
What are the Principles for Sampling and Observing SV30?
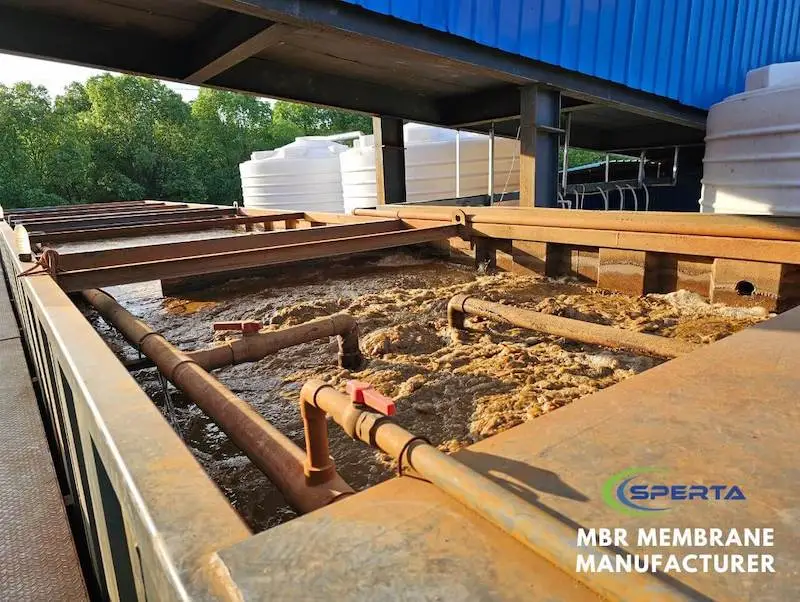
- The sampling location for the sludge volume index should ideally be at the end of the aeration tank, where the aeration is uniform. This makes the water sample more representative and better simulates the secondary clarifier’s settling environment.
- Use a sampler or scoop to collect the sample and quickly pour it into a measuring cylinder to prevent sludge from settling. If too much time passes, stir the sample before pouring it into the cylinder up to the 1000ml mark.
- After stirring the sludge mixture in the cylinder with a glass rod, let it sit for 30 minutes. Then, record the scale at the interface between the settled sludge layer and the supernatant. This measurement is the sludge volume index.
- When conducting the SV30 test, avoid exposure to sunlight and vibrations.
- The first 5 minutes of sedimentation are the most critical for observation. The activity of microbial flocs can be assessed by observing the speed and size of floc coagulation and the layered sedimentation.
Key Points for Observing the State of the Liquid Surface in SV30 Experiments
Oil-like Substances
| Description | Oil-like substances covering the liquid surface, usually thin and not easily noticeable (increased mixture viscosity). |
| Causes | 1. Influences contain mineral oils or emulsions. 2. Influences contain detergents or defoaming agents. 3. Insufficient influent relative to air leads to activated sludge disintegration. 4. Disintegration of aged activated sludge. |
Floating Sludge
| Description | Brownish-yellow or black flocculent masses floating on the liquid surface. |
| Causes | 1. Excessive aeration. 2. Aging of activated sludge (brownish-yellow). 3. Excessive accumulation of oily substances. 4. Sludge poisoning. 5. Filamentous bulking of sludge. 6. Anoxic conditions in sludge. 7. High biochemical SS in the influent. |
Bubbles
| Description | 1. Rows of larger bubbles between the liquid surface and the walls of the measuring cylinder. 2. Smaller bubbles within the floating sludge on the liquid surface. |
| Causes | 1. Excessive aeration. 2. Over-aging of activated sludge. 3. Oily substances on the liquid surface. 4. Denitrification. 5. Filamentous bacteria bulking. |
Odor
| Description | Emitted odors. |
| Causes | 1. A strong earthy smell indicates high sludge activity. 2. A strong foul odor suggests anoxic conditions or an excessive sludge inflow from anaerobic tanks. 3. A strong acidic smell indicates abnormal pH levels in the biochemical tank, skewing low. 4. Other odors may be attributed to the specific smells of industrial wastewater. |

Key Points for Observing the Settling Process in SV30 Experiments
Settleability
| Description | From free settling to flocculent settling stages, settleability is characterized by a clear sludge-water interface, with the sludge settling as a whole. |
| Causes | 1. Normal sludge activity (not caused by excessive activity). 2. Normal sludge loading (no high loading). 3. No excessive aeration. 4. No sludge poisoning. 5. No filamentous bacteria bulking. |
Speed
| Description | Initial floc coagulation speed, the speed from free settling to flocculent settling, and the speed of sludge-water interface formation. |
| Causes | Sludge Activity: The higher the activity, the slower the settling. Sludge Poisoning: Not significant. Sludge Bulking: Settles slowly. Sludge Load: The higher the load, the slower the settling. Sludge Aging: The more aged the sludge, the faster it settles. High Sludge Concentration: Leads to premature flocculent settling. Inert (Inorganic) Material: The more present, the faster the settling. Effects of Water Temperature and Disturbances. |
Interstitial Water
| Description | The state of the water between flocs after flocculation (clarity, suspended particles). |
| Causes | 1. Excessive aeration (increases the number of non-flocculating fine particles). 2. Filamentous bacteria bulking (highly clear). 3. Aging of activated sludge (presence of particles but interstitial water is clear). 4. High sludge loading (turbid interstitial water). |
Floc Formation
| Description | The size of flocs after flocculation, the direction of floc settling (with or against the flow), and the color of the flocs. |
| Causes | 1. Excessive aeration (loose flocs). 2. Sludge aging (coarse and dark in color). 3. High load (small flocs). 4. Filamentous bacteria bulking (fine and dense flocs, smooth sludge surface). |
Key Points for Observing the Supernatant in SV30 Experiments
Clarity
| Description | Overall color and turbidity. |
| Causes | 1. Sludge Load: The higher the load, the worse the clarity. 2. Aeration: Over-aeration leads to poorer clarity. 3. Sludge Poisoning: Poor settleability. 4. Filamentous Bacteria Bulking: Less supernatant but very clear. |
Particles
| Description | Number of suspended particles. |
| Causes | 1. Sludge Aging: The more aged, the more distinguishable particles. 2. Sludge Poisoning: Turbid with fine, scattered particles. 3. Sludge Load: The higher the load, the more indistinguishable dense particles. 4. Inert (Inorganic) Material: Higher levels lead to particle-laden turbidity. |
Interstitial Water
| Description | Clarity of water between scattered particles. |
| Causes | 1. Excessive Aeration: Visible small particles between large ones. 2. Sludge Poisoning: Turbid interstitial water. 3. Aging of Activated Sludge: Presence of particles but clear interstitial water. 4. High Sludge Load: Turbid interstitial water. |
Wall Adhesion
| Description | Cylinder walls have adhering activated sludge flocs. |
| Causes | 1. Aging of Activated Sludge. 2. Excessive Aeration. 3. Inadequate Cylinder Size (Not using a standard 1000ml graduated cylinder). |
Key Points for Observing the Final Sediment in SV30 Experiments
Compactness
| Description | Observing the density of the final settled sludge. |
| Causes | 1. Inflow of inert (inorganic) materials: More leads to denser sludge. 2. Sludge Load: Lower load results in denser sludge. 3. Aeration: Over-aeration leads to less compact sludge. 4. Filamentous Bacteria Bulking: Bulking results in less compact sludge. |
Color
| Description | Observing the depth, gloss, and freshness of the color. |
| Causes | 1. Sludge Activity: Higher activity results in a lighter color. 2. Sludge Aging: Older sludge has a deeper color with no gloss. 3. Sludge Poisoning: The color appears dull. 4. Filamentous Bacteria Bulking: Light and whitish color. 5. Denitrification: Bright coloration. 6. Sludge Concentration: Higher concentration leads to a darker color. 7. Sludge Load: Higher load results in a lighter color. |
Felting Degree
| Description | After settling, the flocculation of sludge is further enhanced, showing a felt-like appearance on the uncompressed surface layer. |
| Causes | 1. Normal-activated sludge has a moderate degree of felting. 2. Aged sludge shows excessive felting. 3. Sludge poisoning, high load, and filamentous bacteria bulking result in no felt-like appearance. |
Bubbles
| Description | Bubbles trapped within the settled floc. |
| Causes | 1. Excessive aeration: Fine bubbles are visible immediately after settling. 2. Over-aging of sludge increases viscosity. 3. Filamentous bacteria bulking. 4. Denitrification: Bubbles can be released after stirring. 5. High temperatures cause the expansion of fine bubbles. |
Conclusion
The Sludge Volume Index (SV30) experiment is a vital tool in the arsenal of wastewater treatment processes, offering more than just numerical data. Through meticulous observation of the liquid surface, settling process, supernatant, and final sediment, wastewater treatment professionals can gain invaluable insights into the health and efficiency of the treatment process. Each observation point, from the clarity and color of the supernatant to the compactness and felting degree of the final sediment, tells a story about the conditions within the treatment system.
Understanding the causes behind the observed phenomena—whether it’s excessive aeration leading to loose flocs, aging of activated sludge resulting in denser sediment, or the presence of inert materials affecting the compactness—allows for targeted interventions to optimize the treatment process. By addressing issues such as sludge load, aeration levels, and filamentous bacteria, operators can significantly improve the settleability of sludge, enhance the overall treatment efficiency, and ensure compliance with environmental standards.
In essence, the SV30 experiment is not just a test but a window into the dynamic world of wastewater treatment, where every bubble, particle, and color shade has a role in painting the bigger picture of system health and performance. With the knowledge from detailed SV30 observations, wastewater treatment facilities can continue to protect our water resources effectively and sustainably.

